Shopware 6 TTFB Performance: Optimizing Load Times for Fast Shops
Why this article?
Optimizing TTFB performance and server load times is a critical factor in the commercial success of online shops in modern e-commerce.
Time to First Byte forms the fundamental first layer of the load-time chain. A low server response time is the most important lever for significantly stabilizing downstream frontend metrics and for bringing Google’s strict requirements for holistic Core Web Vitals optimization into the green range in the first place.
This article is part of our series on Shopware 6 Performance Optimization and takes a deep dive into the technical aspects of the systems, offering practical solutions for developers, hosting administrators, and technical decision-makers to sustainably reduce latency and significantly improve the user experience.

What is TTFB and why is it important for Shopware 6?
Definition of TTFB
Time To First Byte (TTFB) measures how quickly a server responds to a request and returns the first byte to the browser. Especially with Shopware 6, TTFB is a key indicator of whether infrastructure, database, PHP-FPM, and caching work together efficiently or are already reaching their limits under load. A low TTFB allows browsers to start rendering earlier, which has a direct impact on load times, Core Web Vitals, and conversion rates.
TTFB and its importance for SEO
The importance of TTFB for SEO cannot be overstated, as search engines such as Google use fast load times as a ranking factor. A high TTFB indicates potential performance problems in Shopware 6 shops, which leads to a poorer user experience and increases the bounce rate. Optimizing TTFB can improve visibility in search results, as faster shops are favored by search engines, which has a positive impact on organic reach.
Relationship with Core Web Vitals
The relationship between TTFB and Core Web Vitals is evident, as a high TTFB often triggers a cascade of additional performance problems that negatively affect metrics such as Largest Contentful Paint (LCP). Although TTFB itself is not a direct Core Web Vital, it is a strong indicator of server response time, which in turn has a significant influence on LCP and First Contentful Paint. Effective TTFB optimization is therefore a fundamental step toward improving Core Web Vitals and thus optimizing the user experience and strengthening search engine rankings.
💡 Practical tip for developers & admins:
A standard setup is often not sufficient for high-performance enterprise shops. Guide: Shopware 6 PageSpeed Optimization for Core Web Vitals →
Technical causes of slow server response times
Slow database queries and how to optimize them
Slow database queries are among the most common causes of a high Time to First Byte (TTFB) in Shopware 6 shops. They significantly impair performance. Every interaction in the shop—whether loading a product page or adding an item to the shopping cart—can potentially trigger complex database processes.
If these queries are designed inefficiently or the database is inadequately configured, TTFB increases drastically. This noticeably increases the shop’s load time and worsens the user experience. Thorough optimization of these queries is therefore essential for fast, high-converting online shops.
MySQL / MariaDB Optimization for Shopware 6
Fine-tuning MySQL or MariaDB is of central importance for Shopware 6 performance. This includes:
- Correct indexing of database tables: Especially for frequently queried fields such as product IDs or category slugs.
- Fine-tuning server parameters: Optimizing buffer sizes such as the
innodb_buffer_pool_size. (Note: The classic Query Cache is outdated and has been removed in modern database versions). - Analysis of slow query logs: Systematic identification of bottlenecks and blocking queries.
Unoptimized database structures, missing indexes, or blocking plugin queries are often the actual cause of unstable response times. Targeted improvement of query efficiency significantly speeds up Shopware 6 shop load times and thus reduces TTFB.
Elasticsearch / OpenSearch for High-Performance Shopware Search
Especially in larger Shopware 6 projects, search quickly becomes one of the biggest performance and scalability factors across the entire platform. Standard database searches quickly reach their limits with several hundred thousand products, complex filters, variants, synonyms, or typo-tolerant search.
For this reason, high-performance enterprise Shopware architectures today almost always rely on Elasticsearch or OpenSearch as a dedicated search engine. Both systems significantly reduce database load, improve search speed, and enable much more relevant search results—even with typos, phonetic spellings, or incomplete search queries.
Especially under high traffic, the search infrastructure is often critical for stable TTFB values. This is because classic LIKE queries on MySQL generate enormous database load under load, whereas Elasticsearch/OpenSearch is specifically optimized for high-performance search queries.
Why Elasticsearch/OpenSearch Is Essential for Shopware
In enterprise Shopware projects, we regularly observe three typical load problems:
- large product catalogs with several hundred thousand items
- complex filter and variant logic
- high numbers of concurrent search queries during campaigns or seasonal peaks
Without a dedicated search engine, this results in massive database loads, high CPU utilization, and unstable response times.
Elasticsearch/OpenSearch deliberately shifts this load to specialized search indexes and enables:
- extremely fast search responses
- typo-tolerant search
- synonyms & intelligent search logic
- better relevance scoring
- scalable search clusters
- significantly lower database load
- more stable TTFB values under load
Especially in high-traffic shops, we often see that search without Elasticsearch/OpenSearch becomes one of the biggest performance bottlenecks in the entire infrastructure.
Because complex search queries and indexing huge product catalogs generate extreme CPU load, standard servers quickly reach their limits here. In addition to server-side Shopware cache optimization to fundamentally reduce database load, such scenarios require dedicated search nodes. For highly available e-commerce platforms, we configure these search clusters exclusively on the basis of our managed Enterprise Hosting.
Typo-Tolerant Search with the Phonetic Plugin
A frequently underestimated problem in large Shopware shops is incorrect or phonetic search queries.
For example, customers search for:
- “Nikie” instead of “Nike”
- “Addidas” instead of “Adidas”
- “Schibber” instead of “Schipper”
- “Malerflies” instead of “Malervlies”
Standard searches often return no results or poor results in these cases.
For this reason, modern enterprise search architectures additionally rely on so-called phonetic analysis. Terms are indexed phonetically so that similarly sounding terms can still be found. Elasticsearch and OpenSearch provide the official analysis-phonetic plugin for this purpose.
Installing the Phonetic Plugin
Elasticsearch
sudo bin/elasticsearch-plugin install analysis-phonetic
OpenSearch
./bin/opensearch-plugin install analysis-phonetic
The nodes must then be restarted.
Example of a Phonetic Analysis Configuration
{
  "settings": {
    "analysis": {
      "filter": {
        "shopware_phonetic": {
          "type": "phonetic",
          "encoder": "double_metaphone",
          "replace": false
        }
      },
      "analyzer": {
        "shopware_search_analyzer": {
          "tokenizer": "standard",
          "filter": [
            "lowercase",
            "shopware_phonetic"
          ]
        }
      }
    }
  }
}
The plugin generates additional phonetic tokens, thereby enabling typo-tolerant search results even for misspellings or differently spelled terms.
Important Architectural Tradeoff for Phonetic Searches
In practice, we often see incorrectly configured phonetic setups that actually worsen search quality.
A typical mistake:
The phonetic filter completely replaces the original tokens (replace=true).
This often results in unexpected search hits and relevance problems.
In high-performance enterprise setups, we therefore usually rely on separate search fields:
- normal search field
- fuzzy search field
- phonetic search field
The results are then weighted differently (“boosting”).
This keeps the normal search precise while also catching typos and phonetic variants.
Shopware Integration of Elasticsearch/OpenSearch
Shopware already supports Elasticsearch/OpenSearch natively. In larger projects, however, the standard configuration is usually not sufficient.
Particularly relevant here are:
- optimized analyzers
- language-dependent tokenizers
- synonym handling
- index sharding
- reindexing strategies
- queue-based indexing
- separate search nodes
- heap management
- JVM tuning
Especially with several hundred thousand products, search architecture quickly becomes an infrastructure topic in its own right.
In our enterprise projects, we regularly see that it is not the Shopware application itself but incorrect Elasticsearch/OpenSearch configurations that are the actual causes of high load spikes or unstable search times.
Typical Enterprise Scenario with Large Product Catalogs
Very large product inventories generate enormous reindexing loads.
Particularly critical:
- large ERP imports
- price updates
- variant changes
- Rule Builder changes
- bulk uploads
If complete search indexes are rebuilt in the process, this generates massive load on CPU, RAM, and storage.
Professional enterprise setups therefore rely on:
- incremental reindexing
- queue-based processing
- separate search nodes
- optimized refresh intervals
- dedicated OpenSearch/Elasticsearch clusters
Especially during Black Friday or TV campaigns, this architecture often determines whether a shop remains stable or collapses under search load.
Our Experience from Enterprise Shopware Projects
In recent years, we have optimized numerous large Shopware platforms with complex search requirements—including B2B portals, international product catalogs, and high-traffic enterprise shops.
One thing becomes clear time and again: standard search is not sufficient for large shops in the long term.
That is why, with HQ GmbH’s enhanced enterprise search, we developed our own high-performance Shopware search solution specifically designed for large volumes of product data, typo-tolerant search logic, synonyms, intelligent relevance scoring, and high scalability.
More about HQ’s enhanced search for Shopware
Impact of Slow Plugins and API Dependencies
Unoptimized extensions are another critical cause of high TTFB and performance problems in Shopware 6. Every plugin—especially poorly programmed tools or those with complex database interactions—can increase server response time.
External API dependencies (for payment gateways, shipping providers, or marketing tools) also significantly affect the load time of Shopware 6 shops when their response times are slow. Caching API responses and regularly reviewing plugins are therefore crucial for maintaining performance.
The Plugin Paradox: Why Many Plugins Slow Down the Shop
In our daily work as a Shopware agency, during performance audits in the DACH region, we regularly encounter shops with 60, 70, 80, or more active plugins. Every extension that does not provide a purely administrative function in the admin area (such as a DATEV export) requires valuable system resources:
- Longer code execution (PHP): Plugins register for events or extend core classes via decorators or subscribers. More code per page view increases TTFB.
- Additional database queries: Custom tables and complex SQL joins massively increase load time.
- Frontend overhead (CSS & JavaScript): Despite compilation, the total size of asset files grows, which slows rendering in the browser.
- Undermining the HTTP cache: Dynamic plugin content often unintentionally prevents pages from being cached correctly in Varnish or the Symfony cache.
Hidden Performance Killers: High Downloads ≠ High Quality
Our technical analyses regularly show that a lack of performance optimization is no longer merely a problem with niche extensions. Even established Shopware plugins with five-figure download counts in the official store often turn out to be major bottlenecks upon closer code analysis.
For online retailers in Germany, Austria, and Switzerland, this means a high risk: poorly programmed plugins block valuable server resources, ruin Google Core Web Vitals, and thereby directly jeopardize search engine rankings as well as conversion rates.
Infrastructure as the Foundation for Low TTFB Values
The server response time of a Shopware 6 shop does not depend exclusively on optimizations in the application code. The underlying infrastructure is especially decisive. Targeted Shopware hosting optimization requires the perfect interplay of lean code and dedicated server architecture. As a certified Shopware agency we analyze your overall system holistically as part of our technical analysis and consulting in order to completely eliminate hidden bottlenecks at the application level.
Typical Scaling Problem During Black Friday Campaigns
During Black Friday, TV, or newsletter campaigns, many Shopware shops reach their technical limits within a very short time. What stands out is that the actual cause is rarely the sheer number of visitors. Particularly critical are high volumes of simultaneous uncached requests, dynamic shopping cart processes, external API dependencies, and aggressive cache invalidations caused by price or stock changes.
In practice, we often observe that shops under load do not primarily fail due to CPU limits, but because of blocked PHP-FPM workers, overloaded databases, or undersized Redis instances. This becomes especially problematic in extensive plugin landscapes, as every additional extension generates further database queries, event listeners, and PHP execution time.
In such situations, many companies respond in the short term with additional CPU capacity or larger servers. However, purely vertical scaling often solves the underlying architectural problems only temporarily. What matters much more are stable cache hit rates, clearly separated Redis areas for sessions and object cache, optimized database queries, and an infrastructure that can absorb load spikes in a controlled manner.
Especially before high-revenue campaigns, a comprehensive load test of the entire Shopware infrastructure is therefore recommended. This is the only way to identify and resolve bottlenecks in PHP-FPM, the database, storage, or external interfaces at an early stage, before slow load times or server outages directly impact revenue and conversion rate.
Ideally, contact our team before the launch of planned campaigns, sales promotions, or Black Friday events. Together, we analyze your existing Shopware infrastructure, identify potential bottlenecks, and prepare your shop specifically for upcoming load spikes—before performance problems, high server load, or unstable load times directly impact revenue and conversion rate.
→ Request a Shopware performance analysis now
Typical Load Scenarios in Large Shopware B2B Projects
In larger Shopware B2B projects, we regularly observe complex load spikes outside of actual frontend traffic. ERP synchronizations, price imports, Rule Builder calculations, exports, and large product updates in particular generate significant load on the database, Redis, and PHP-FPM.
This becomes particularly critical for product catalogs with several hundred thousand items and simultaneously active import processes. If large cache areas are invalidated in the process, the number of uncached requests rises massively for a short period. Without a properly coordinated cache strategy, PHP workers and database processes quickly reach their limits.
In such scenarios, purely vertical scaling of server resources is often no longer sufficient. What then matters are separate Redis instances, optimized cache invalidation strategies (significantly mitigated from Shopware 6.7 onward by “delayed cache invalidation”), queue systems, and a clearly segmented infrastructure for frontend, database, and search servers. Import, export, and indexing processes in particular should be consistently decoupled via queue systems to avoid load spikes on the frontend.
The Hardware Misconception Under Load
When load spikes increase during campaigns such as Black Friday, many online retailers instinctively respond by booking more CPU capacity at short notice. In an acute emergency, this is often the only way out. But many shop operators make critical mistakes here.
Instead of CPU overload, in Shopware systems with a high plugin density it is almost always the memory (RAM) that is the actual bottleneck. Unoptimized plugin code blocks PHP processes and leads to memory leaks.
- Immediate measure in an emergency: If it is already too late for code optimizations, check server load and RAM consumption—and specifically allocate more RAM to the server to stabilize the PHP-FPM processes.
Further information on optimal infrastructure can be found in the article “Optimize Shopware Hosting Performance”.
Performance Engineering in Shopware 6
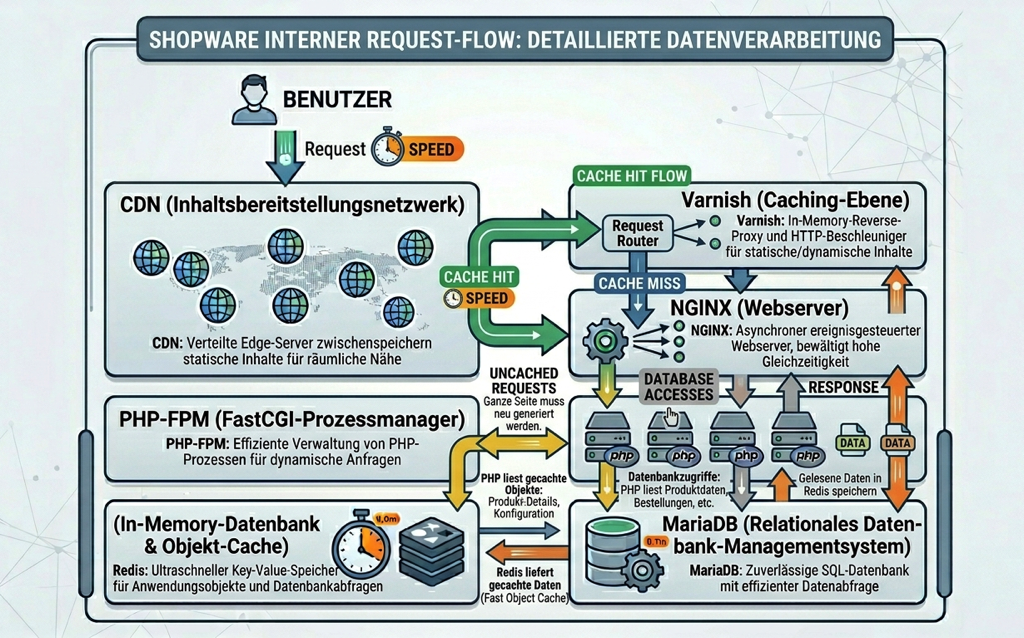
Redis Object Cache and HTTP Cache
Using the Redis Object Cache is a fundamental step in optimizing Shopware 6. Redis stores frequently required data directly in memory. This reduces slow database queries and significantly lowers TTFB.
In addition, the HTTP cache (often implemented via reverse proxies) is crucial. It serves static and frequently requested content directly, without the backend server having to regenerate it each time. This combination is essential for fast load times.
Typical Redis Errors in Shopware Projects
- Shared instance for sessions and cache: If sessions and the object cache run on the same Redis instance, this leads to evictions of important session keys at 100–200 concurrent requests. Customers are suddenly logged out or shopping carts disappear.
- Insufficient RAM budget: Large Shopware projects with several hundred thousand products often adopt the Redis configuration from the standard documentation 1:1. In practice, however, these projects require significantly more Redis RAM. Import processes, the Rule Builder, and aggressive cache invalidations in particular generate significant load spikes.
Varnish Integration for Maximum Loading Speed
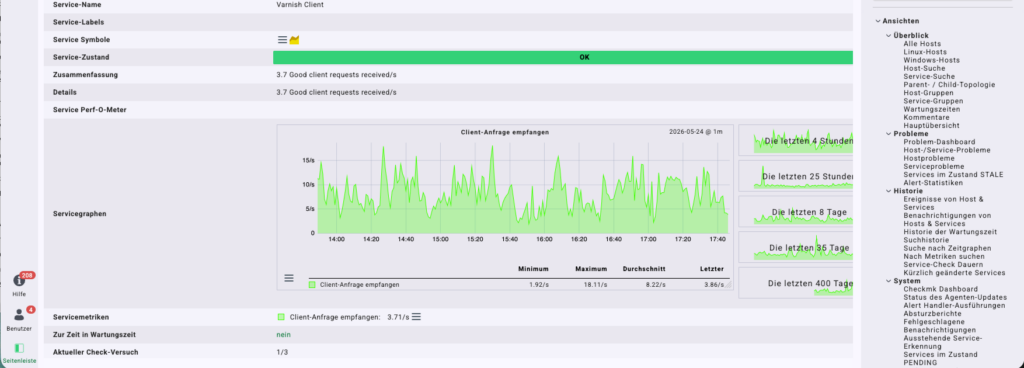
Screenshot Varnish Monitoring Client Requests
Integrating Varnish as a reverse proxy cache is a highly effective measure for Shopware 6 shops. Varnish stores complete HTML pages in RAM and serves them directly on repeated requests. This completely relieves PHP processes and the database. It drastically reduces TTFB and enables extremely high requests per second (hits/sec).
Benchmarks and Cache Hit Rates
Well-configured Shopware/Varnish setups from Shopware 6.7 and 6.8 onward often achieve cache hit rates well above 90% on category and product pages (before Shopware 6.7, based on our experience, the rates are around 50%). If the values remain below this level over the long term, this usually indicates problems with cache invalidation or session logic.
Common Varnish Misconfiguration
Especially in larger plugin landscapes, we often observe that unnecessary cookies or personalized HTTP headers massively reduce the Varnish cache hit rate. Although Varnish is active, a large portion of the traffic therefore still reaches the web server directly.
Local CDNs for Targeted Asset Delivery
By offloading product media, CSS, and JavaScript to a dedicated server, the main server is further relieved. With a specialized NGINX configuration (without PHP), images and stylesheets can be delivered significantly faster because there is no PHP overhead.
The CDN myth explained: A persistent rumor claims that a CDN removes the browser limitation of 6 parallel requests. However, this was only the case in the days of HTTP/1.1. Since HTTP/2 and HTTP/3 became established, this limitation has become obsolete thanks to multiplexing. The real value of a local CDN today lies purely in massively reducing server load and automated image optimization (e.g. on-the-fly conversion to WebP / AVIF).
Monitoring & Observability in Shopware
Monitoring & Observability in Shopware 6: Enterprise Monitoring for Maximum Stability
In high-traffic e-commerce environments, pure hosting without deep system insights is an incalculable revenue risk. Performance engineering at enterprise level requires seamless monitoring and data-driven observability of all infrastructure components. Only those who detect anomalies, memory bottlenecks, and inefficient code before they manifest as high server response times (TTFB) or server outages can successfully manage business-critical campaigns such as Black Friday.
In enterprise Shopware projects, we often use Checkmk for centralized monitoring of infrastructure, PHP-FPM, Redis, database load, and OpenSearch clusters. Especially during high load spikes or large import processes, centralized analysis makes it possible to identify early whether worker queues are backing up, Redis memory is becoming scarce, or database processes are blocking.
Professional monitoring only becomes truly effective through intelligent, threshold-based alerting. If critical system parameters—such as an impending memory overload or blocked processes—exceed defined limits, the system automatically issues emergency notifications. These alerts are forwarded in real time to communication channels such as Slack, Microsoft Teams, or PagerDuty. This ensures that DevOps teams can react and resolve bottlenecks before customers notice delays in the frontend.
At the heart of monitoring are the application’s two most important processing systems: PHP-FPM monitoring and Redis memory usage. PHP-FPM monitoring tracks the utilization of worker processes (active vs. idle workers) in order to detect a backlog of uncached requests at an early stage. At the same time, monitoring Redis memory usage is critical. If RAM consumption by Redis instances rises unexpectedly, automatic data eviction becomes a risk. Monitoring prevents session keys from being deleted and customers from losing their shopping carts unnoticed.
As the product catalog grows, the load shifts to search and data storage. Continuous scanning of the slow query logs filters out inefficient SQL queries caused by unoptimized plugins or missing table indexes. At the same time, using a modern enterprise search requires precise monitoring of the OpenSearch heap (Java Virtual Machine memory). If the allocated JVM heap fills up, intensive garbage collection cycles occur, which massively slow down frontend search queries.
Monitoring cache hit rates (Varnish and Redis) shows directly how efficiently the caching infrastructure is working. In an optimized Shopware scenario, cache hit rates on content and category pages must remain above 90% over the long term. If this value drops, the dashboard immediately signals a problem. The cause is usually overly aggressive cache invalidation by ERP interfaces or improper HTTP headers from third-party plugins that block caching in RAM.
While infrastructure metrics show the “what,” deep profiling tools such as Tideways or Blackfire.io provide the “why.” As highly specialized APM solutions (Application Performance Monitoring), they record the exact code execution of Shopware 6 in the background. They create detailed call graphs, visualize the runtime behavior of individual event subscribers, and isolate unoptimized plugin loops (N+1 problems) or sluggish external API interfaces down to the exact line in the PHP code.
Typical Enterprise Architecture for Shopware 6
In larger Shopware enterprise projects, we often rely on redundant and scalable infrastructure architectures to ensure stable TTFB values, high availability, and maximum resilience.
A typical Shopware 6 enterprise environment consists, for example, of:
2 redundant load balancers for traffic distribution and high availability
2 dedicated Varnish servers for HTTP caching and relieving the PHP backend
2 Redis servers for sessions, object cache, and queue processing
2 OpenSearch/Elasticsearch nodes for high-performance product searches and filter logic
2 web servers with Apache and PHP-FPM for horizontal scaling
2 MySQL/MariaDB servers as a master-master setup or database cluster
1 separate backend/admin server for administration, imports, and background processes
Depending on project size, additional upstream NGINX CDN servers for fast delivery of static assets and relieving the Apache/PHP-FPM infrastructure, queue workers, storage clusters, dedicated import servers, or Kubernetes-based container infrastructures are added.
Especially in larger B2B or enterprise projects, this segmentation prevents load spikes in search, imports, or cache invalidations from affecting the entire shop infrastructure.
Modern Shopware enterprise infrastructures are designed so that individual components such as web servers, Varnish nodes, or OpenSearch clusters can be horizontally expanded within minutes depending on the load profile. This allows short-term traffic spikes to be absorbed without a complete infrastructure migration.
What TTFB values are realistic for Shopware 6?
The Practical Paradox: Why Lab Benchmarks Fail in Everyday Shopware Use
There are numerous performance benchmarks on the market, but without exception they assume clinically clean optimal values. Our many years of experience with technical audits in the DACH region show a completely different picture: Even an optimally optimized Shopware 6 homepage usually remains fast for customers only until the marketing employee adds the first unoptimized image, installs an SEO plugin, or integrates GTM with tracking providers.
A single uncompressed high-res banner in the hero area is enough to completely collapse Google Core Web Vitals (especially Largest Contentful Paint / LCP). The problem is rarely the server hardware, but rather the lack of automatic protection mechanisms. A stable shop therefore does not need theoretical lab values, but a practical hosting setup that automatically absorbs editorial errors in daily business.
Laboratory values from common benchmarks often promise fantastic response times for homepages between 50 ms and 150 ms. Our experience shows, however: Such peak values are only achievable in practice with an absolutely minimalist, content-poor homepage—provided aggressive caching via Varnish and Redis is used with minimal plugin density at the same time. In productive, normally used online shops, realistic server response times (TTFB) in everyday operation are usually between 200 ms and 600 ms.
Why is Shopware slow despite good hardware?
The Most Common Causes of Poor Performance in Shopware 6
Many shop operators assume that slow load times are primarily caused by underpowered server hardware. In practice, however, during Shopware performance audits we see architecture, cache, or plugin problems far more often than pure CPU limits. Even powerful servers quickly reach their limits if database queries are inefficient, too many plugins are active, or caching mechanisms do not work correctly.
What is meant by plugin overhead?
Every active Shopware plugin extends the core via subscribers, events, decorators, or additional services. As the number of active extensions increases, the amount of PHP code that must be executed per request increases significantly.
Especially in larger Shopware projects with 60 or more active plugins, we regularly observe significantly longer PHP runtimes, higher RAM utilization, and rising TTFB values. Plugins that generate additional database queries or introduce dynamic content into cached areas are particularly critical.
Why is missing caching so problematic?
Without a correctly configured HTTP cache, every request must be processed completely by PHP and the database. Instead of serving content directly from RAM, Shopware starts large parts of the framework again for every request.
Especially with high traffic, this quickly leads to overloaded PHP-FPM workers, rising database load, and unstable response times. Reverse proxies such as Varnish or the Symfony HTTP cache are therefore among the most important performance components of modern Shopware infrastructures.
Why do uncached requests quickly become a problem?
Certain areas such as the shopping cart, checkout, customer account, or personalized content can only be cached to a limited extent. Each of these requests must be processed completely dynamically.
If the number of such uncached requests rises sharply under load, PHP-FPM, the database, and sessions quickly reach their limits. Especially in shops with many simultaneous users or high plugin density, this often leads to strongly fluctuating TTFB values or complete load spikes.
Why does PHP-FPM often become the bottleneck?
PHP-FPM processes only a limited number of parallel requests at the same time. If individual requests take too long because of slow database queries or inefficient plugins, the available worker processes are blocked. The number of free PHP workers also cannot be configured arbitrarily, because each PHP worker requires between 80 and, with Shopware, more typically 200 MB of RAM.
New visitors then have to wait until free PHP workers are available again. The result is sharply rising server response times, long load times, and, in extreme cases, 502/504 errors under high load.
What are bad database queries?
In many performance audits, we encounter inefficient database queries that generate unnecessarily many individual requests. The so-called N+1 problem occurs particularly often: Instead of retrieving data collectively, information is loaded individually within loops.
This creates hundreds of additional database queries per page view, placing a massive load on MySQL or MariaDB and significantly worsening load times.
What role does database structure play?
The structure of the database also has a significant influence on Shopware performance. If important indexes are missing in plugin or project tables, the database must scan large tables completely (full table scans).
Especially on large category pages with many filters or Rule Builder logic, missing indexes quickly lead to CPU spikes and blocking database queries. Large product catalogs or complex filter logic are also highly sensitive to missing or incorrectly set indexes.
Why does TTFB get worse despite Redis/Varnish?
What does a high cache-miss rate mean?
If a page (e.g. after an import) is not yet in the cache, a cache miss occurs. Varnish has to forward the request completely to PHP-FPM. If the Shopware core is overloaded by unoptimized plugins, TTFB explodes on the first request.
How do session problems ruin load time?
As soon as a customer places an item in the shopping cart or logs in, a personalized session starts. Poorly configured caches route these requests completely past Varnish directly to PHP, making caching ineffective for that user.
Why is aggressive cache invalidation fatal?
To keep data up to date, the cache must be deleted (invalidated) when changes occur. However, if ERP interfaces or plugins completely clear the cache every minute, the shop effectively runs permanently without an active cache.
How do plugin cookies block caching?
Many third-party extensions (e.g. for consent management or tracking) set improper cookies or send incorrect HTTP headers such as Cache-Control: no-store. This prevents Varnish from storing the page in RAM.
What happens in the uncached areas?
For logical reasons, the shopping cart, search, and checkout must never be cached statically. These areas always hit PHP-FPM and the database unfiltered—unoptimized queries immediately affect TTFB here.
The “Clear Cache” Button: An Underestimated Performance Killer in Everyday Shopware Use
In our daily work on performance audits in the DACH region, we repeatedly encounter critical user behavior in the backend: To review editorial changes immediately, employees use the global “Clear cache” function in the administration after almost every adjustment. What looks like a harmless click at first is technically a disaster for load time. Global deletion forces the entire cache to be rebuilt in a computationally intensive process. Shopware 6 has an intelligent, event-based system that automatically invalidates changed products or prices in the background. A manual wipe is generally completely unnecessary and puts live revenue at risk.
When is shared hosting no longer sufficient?
At how many simultaneous users is a crash likely?
As soon as more than 10 to 15 customers are actively interacting at the same time (e.g. in the shopping cart or checkout), the shared PHP workers in shared hosting are usually no longer sufficient. The result is long load times or 502 Bad Gateway errors.
When does a large product catalog slow down the shop?
From around 5,000 to 10,000 products or complex variants onward, the database requires massive RAM buffers (innodb_buffer_pool_size). Because shared hosting plans severely restrict this memory, performance collapses during catalog queries.
Why does Elasticsearch fail in shared hosting?
As a Java application, Elasticsearch requires an excessive amount of dedicated memory (at least 2 to 4 GB RAM). For security and resource reasons, modern search generally cannot be installed at all in shared hosting.
How do ERP interfaces burden the system?
Real-time or minute-by-minute synchronization with the ERP system (e.g. prices, stock levels) generates massive CPU and RAM load spikes. In shared hosting, these imports block the few available workers and bring the frontend to a standstill for customers.
What happens during marketing campaigns (e.g. Black Friday)?
Shared hosting provides no scaling and no upstream Varnish caching for load spikes. If hundreds of users arrive suddenly because of newsletters or promotions, the server becomes overloaded and the provider often automatically suspends the account.
Why is B2B business impossible in shared hosting?
B2B functions require customer-specific prices, complex budgets, and huge order lists. These largely bypass the standard cache. Almost every click is a computationally intensive, uncached request that immediately overloads shared hosting.
How many plugins are problematic?
At how many plugins does a Shopware 6 shop become noticeably slower?
There is no fixed upper limit because code quality is decisive. Our practical experience shows, however, that from around 40 to 50 active plugins onward, the risk of performance degradation increases drastically. In this range, conflicts between extensions, blocked database queries, or bypassing the Varnish cache frequently occur, massively worsening server response time (TTFB).
Why is the raw number of plugins not the only thing that matters?
A strict distinction must be made between administrative and global plugins. A plugin that merely creates a DATEV export once a day in the backend has no impact whatsoever on load times for customers. By contrast, just one or two poorly programmed marketing or SEO plugins that hook into global core processes and trigger inefficient SQL loops can bring the entire PHP-FPM infrastructure to a standstill and cause shopping cart abandonment.
📞 Too many plugins slowing down your shop? We perform the quality check!
Do not let unoptimized extensions destroy your conversion rate. Through our Shopware audit, our experts perform an in-depth plugin audit. We isolate the exact performance bottlenecks in your system and consolidate your plugin landscape for maximum speed.
Which areas cannot be cached meaningfully?
Which areas of a Shopware 6 shop cannot be cached meaningfully?
All pages and functions that process user-specific, dynamic, or security-relevant data must never be stored statically in the HTTP cache (such as Varnish or the Symfony cache). These include the entire checkout process, the shopping cart page, the personal customer area (“My Account”), registration, as well as live search and filter functions. If these areas were cached, customers would see other users’ data, shopping carts, or prices—a massive data protection and logic risk.
Why are these uncached areas so performance-critical?
Because the protective HTTP cache has to be bypassed completely in these areas, every single customer click hits the server hardware unfiltered. PHP-FPM has to start the entire Shopware framework, including all active plugins, within a fraction of a second. If unoptimized plugins are running in the background or inefficient database queries are executed in precisely these sensitive zones, server response time (TTFB) explodes. This directly leads to noticeable delays and frustration during checkout.
How is the shopping cart content in the header handled on otherwise cached pages?
To allow content pages such as the homepage or category pages to load at lightning speed from the Varnish cache despite a filled shopping cart, Shopware uses modern technologies. The page layout comes statically from the cache, while the personalized shopping cart button in the header is subsequently loaded dynamically via an Ajax request from the browser or via so-called ESI tags (Edge Side Includes). However, if this dynamic loading is poorly programmed, it blocks rendering of the entire page.
How do you protect uncached areas from a performance collapse under load?
Because checkout and search demand maximum server performance, only perfectly coordinated performance engineering helps here. This includes adequately sized PHP-FPM workers, a high-performance database (MariaDB/MySQL) with optimized indexes, and a separate Redis Object Cache for sessions. Only when the infrastructure is configured so that uncached database queries are processed within a few milliseconds does the shop remain completely stable in checkout even during extreme Black Friday load spikes.
Why do shops collapse on Black Friday?
Why do Shopware shops often collapse on Black Friday despite normal hosting?
Black Friday suddenly generates extreme traffic spikes in which thousands of customers interact at the same time. The main problem is not opening the homepage (which is usually cached), but the simultaneous rush on uncached processes. When hundreds of users add items to the shopping cart, validate coupon codes, or go through checkout at the same moment, PHP-FPM has to calculate each of these requests individually and in real time. This overwhelms unprepared server infrastructures within seconds.
What role does memory (RAM) play in this load collapse?
A widespread misconception is that you simply need to book more CPU cores when server problems occur on Black Friday. Practice shows, however: In shops with a high plugin density (60 or more plugins), memory (RAM) is the actual bottleneck. Unoptimized plugin code blocks PHP processes and creates memory leaks. If RAM fills up, the server crashes completely. The immediate measure in an emergency is therefore always: check server load and scale RAM up specifically to stabilize the PHP workers.
Why do Varnish and Redis fail on Black Friday when configured incorrectly?
Even when high-performance components are installed, they can fail under full load. A common mistake in Shopware projects is running customer sessions and the object cache on the same Redis instance. Under extreme traffic, this leads to so-called evictions: Important session data is displaced from RAM, causing customers to be suddenly logged out or their shopping carts to disappear. At the same time, faulty cookies from third-party plugins often completely bypass Varnish caching, so the load overwhelms the backend unfiltered.
How do ERP interfaces bring the shop to a standstill during a major campaign?
During a Black Friday campaign, minute-by-minute stock and price synchronization with the ERP system usually runs in the background to prevent overselling. These import processes generate massive CPU and RAM load spikes. In shared hosting or on unoptimized servers, these synchronizations block the few available PHP-FPM workers. This means: While the ERP system synchronizes data, the system blocks and the frontend becomes unusably slow for customers ready to buy.
📞 Revenue collapse looming on Black Friday? We save your campaign!
Do not lose money on the highest-revenue day of the year because of server downtime or minute-long load times. Through our 24/7 performance emergency support, our Shopware experts analyze your server load in real time, absorb RAM bottlenecks, optimize your Redis configuration, and keep your checkout stable even during extreme load spikes.
How can performance problems be detected early?
How do you detect performance problems in Shopware 6 before the server crashes?
Performance problems almost always emerge gradually. The safest early warning system is regular monitoring of server response time (Time to First Byte / TTFB). If you notice that TTFB on uncached pages such as search or checkout slowly rises from 200 ms to over 1,000 ms in daily operation, the system is already overloaded. Sudden spikes in RAM consumption or an increasing number of abandoned shopping carts in the analytics tool are also clear indicators of creeping performance bottlenecks.
Which tools help developers identify bottlenecks in the code?
In development mode, the integrated Symfony Profiler is the most powerful tool. It shows you exactly how many milliseconds each plugin requires and how many database queries are fired per page view. For live operation (production environment), professional Application Performance Monitoring tools (APM) such as Tideways or Blackfire.io are indispensable. These tools create detailed call graphs and automatically isolate unoptimized third-party plugins or slow API interfaces in the background.
How can inefficient database queries be identified early?
The most important place to look is the so-called slow query log of your MySQL or MariaDB database. This logs all queries that exceed a defined duration (e.g. longer than 0.5 seconds). If queries from installed plugins regularly appear there, this almost always indicates missing database indexes or an acute N+1 query problem. If these loops are not fixed early, they lead to blocked tables (table locks) during the next traffic wave and bring the shop to a standstill.
How do you monitor actual loading speed for end customers?
For this, Google Core Web Vitals are used, especially Largest Contentful Paint (LCP) and Interaction to Next Paint (INP). Tools such as Google Search Console or the Chrome User Experience Report (CrUX) provide real user data (Real User Monitoring). If these values deteriorate after adding new marketing banners, installing SEO extensions, or integrating new tracking scripts in Google Tag Manager, you must react immediately to avoid ranking losses.
📞 First signs of server sluggishness? We put your system through its paces!
Do not wait until your Shopware shop completely buckles on the next high-revenue day. With our Shopware analysis, our experts perform an in-depth system audit, analyze your slow query logs, and eliminate hidden code bottlenecks before they become revenue killers.
What role does PHP-FPM play?
What role does PHP-FPM play in Shopware 6?
PHP-FPM (FastCGI Process Manager) is the functional computing engine of your online shop. While caching layers such as Varnish serve static pages, PHP-FPM processes all dynamic operations. The process manager controls execution of the Shopware core, processes the logic of active plugins, and communicates directly with the database to generate dynamic content.
Why does PHP-FPM quickly become a bottleneck in Shopware 6?
A server has only a limited number of simultaneous PHP-FPM processes (so-called workers). If unoptimized plugins, slow API interfaces, or inefficient database queries extend code execution time, the respective worker remains blocked. If more requests arrive at that moment than there are free workers, a backlog forms: subsequent customers have to wait, server response time (TTFB) explodes, and in the worst case the shop crashes with a “502 Bad Gateway” error.
What happens when there are too many uncached requests in PHP-FPM?
Certain areas such as the shopping cart, search, or the entire checkout process can never be statically cached. Each of these clicks forces PHP-FPM to start the complete Shopware framework, including all installed plugins, within a fraction of a second. A high number of simultaneous uncached requests (e.g. during a newsletter campaign) leads to an immediate performance collapse without sufficient PHP-FPM resources.
How do you optimize PHP-FPM for Shopware shops with many plugins?
The most important lever is adjusting the maximum worker processes (pm.max_children) based on the available memory (RAM). Because Shopware shops with 60 or more plugins often consume 200 MB to 250 MB RAM per worker, the number of workers must be calculated precisely. In addition, the parameter pm.max_requests (e.g. set to 1000) helps: It restarts workers after a fixed number of requests in order to immediately clear memory leaks from unoptimized plugins out of RAM.
When is a CDN really worthwhile?
When is a CDN really worthwhile for a Shopware 6 shop?
A Content Delivery Network (CDN) is worthwhile whenever the main web server should be noticeably relieved of static load in order to keep valuable resources available for checkout. A CDN is particularly profitable for shops with large product catalogs and many high-resolution images, with strongly fluctuating traffic from marketing campaigns, and for international sales. As soon as customers access the shop from different countries or regions, a CDN shortens the physical distance and serves media at lightning speed via regional servers (edge nodes).
What technological advantage does a CDN offer in everyday e-commerce?
The biggest lever of modern CDNs lies in automated on-the-fly image optimization and scaling. If the marketing team uploads huge uncompressed banners in the backend, the CDN catches this data monster on the first request. It automatically converts the image into extremely lightweight modern formats such as WebP or AVIF and adjusts the dimensions to the end device. This not only relieves server memory (RAM), but immediately improves Largest Contentful Paint (LCP) in Google Core Web Vitals.
Is it true that a CDN removes the browser limit of 6 parallel requests?
No, that is an outdated web design myth that persists stubbornly. This limitation existed only in the days of HTTP/1.1. Modern Shopware infrastructures use HTTP/2 or HTTP/3 by default. Thanks to so-called multiplexing, browsers can now load countless files simultaneously over a single connection. The true value of a CDN today therefore no longer lies in bypassing browser limits (domain sharding), but purely in massively relieving the web server and reducing global latency.
Is a local CDN without a worldwide server network sufficient?
Yes, absolutely. Even a local or dedicated CDN—for example via a separately configured NGINX server without PHP integration—offers enormous advantages in the DACH region. Because images, CSS, and JavaScript are streamed via a separate server, the main Shopware server does not have to sacrifice a single PHP-FPM process for static files. This effectively protects the system from the dreaded RAM bottleneck during traffic spikes and keeps the server completely stable during checkout.
How does a high TTFB affect conversion rates?
How does a high TTFB affect the bounce rate?
If the server does not respond for seconds after a click (high TTFB), the screen remains white. Users no longer wait in modern e-commerce—they bounce immediately. A delay in server response time of just one second can increase the bounce rate by more than 50%, as customers impatiently return to Google search.
Why are mobile users particularly affected by slow server response time?
Mobile connections via smartphones (4G/5G) already have higher latency due to the network. When this mobile network meets a high server TTFB, the customer’s waiting time multiplies. Since well over half of traffic now comes from mobile devices, the mobile conversion rate is the first to collapse on sluggish systems.
Why does a high TTFB cause more shopping cart abandonment?
Clicking the “Add to cart” button in Shopware 6 triggers a dynamic, uncached process. This must be processed directly by PHP and the database. If this server response takes too long, the interface reacts with a delay. This unsettles the customer and causes the purchasing process to be abandoned in frustration.
How are server delays and checkout abandonment related?
The checkout area is the most sensitive zone of the online shop and, for security reasons, can never be statically cached. If loading payment methods or the final click on “Place order with obligation to pay” is delayed by slow plugins or blocked database queries, checkout abandonment rises dramatically because customers suspect a technical error.
What influence does TTFB have on general customer trust?
Loading speed is an unconscious quality signal in e-commerce. An online shop that reacts sluggishly and stutters with every click appears unprofessional. Customers transfer this poor performance directly to the retailer’s reliability, customer service, and above all the security of their payment data—purchase confidence is lost.
Is HTTP/3 useful for Shopware?
Is HTTP/3 useful for Shopware 6?
Yes, using HTTP/3 is extremely useful for Shopware 6—although primarily for mobile users and under unstable web conditions. While the jump from HTTP/1.1 to HTTP/2 was a milestone because files could be loaded in parallel over a single connection, HTTP/3 optimizes the underlying transport layer. Since modern shops generate well over half their traffic via smartphones, HTTP/3 delivers a measurable advantage for mobile conversion rates.
What decisive advantage does HTTP/3 offer mobile Shopware customers?
HTTP/3 is no longer based on the classic TCP protocol, but uses QUIC (over UDP). This provides the so-called “Connection Migration” feature. If a customer is sitting on a train or leaves the house and their smartphone switches unnoticed from home Wi-Fi to the mobile network (4G/5G), the connection briefly drops under HTTP/2. Under HTTP/3, the session remains completely stable and seamless. This prevents technical interruptions in the middle of the sensitive checkout process.
How does HTTP/3 solve the problem of Head-of-Line Blocking (HoL)?
Under HTTP/2, all files (images, JS, CSS) are transferred over a single TCP channel. However, if just one data packet is lost on the way to the smartphone (e.g. because of a brief radio dead zone), the entire data stream stops until that one packet has been requested and loaded again. HTTP/3 completely isolates the individual data streams from one another. If a packet belonging to a product image is lost, the rest of the Shopware page (such as the CSS layout or important scripts) continues loading undisturbed.
Does HTTP/3 also improve the server’s technical TTFB value?
Only minimally on the very first connection—and this is where the biggest misconception lies: HTTP/3 is not a miracle cure and never replaces missing performance optimization! The protocol only accelerates the transport path in the network. HTTP/3 has absolutely no influence on Shopware’s internal computing time (PHP-FPM, database queries, Redis queries). A slow shop with 80 unoptimized plugins, missing database indexes, or poor cache configuration remains sluggish on the application side even with HTTP/3 and continues to lose customers.
How can HTTP/3 be integrated into an existing Shopware infrastructure?
HTTP/3 can be integrated into Shopware most efficiently via an upstream CDN or an NGINX reverse proxy. Because of the high CPU effort for cryptographic processing in user space, offloading to the edge (CDN) is technically advantageous, while an upstream NGINX proxy is often the more cost-effective alternative.
Mathias Goldhan
Mathias Goldhan laid the foundation for today’s digital agency in 1994 and has been leading HQ GmbH strategically and operationally since 2005. With more than three decades of experience in software development and systems architecture, he advises medium-sized businesses and brands on the digitalization of business-critical processes. He is the strategic mind behind HQ GmbH’s positioning among the Top 100 owner-managed digital agencies (iBusiness/BVDW).
As a recognized SaaS pioneer and specialist in high-performance hosting, he designs highly available cluster infrastructures and leads the technical rescue of stalled large-scale e-commerce projects. He contributes his expertise in resilient systems and API-based B2B automation internationally between the company’s headquarters in Thuringia and its branch in Spain.